How to find cancellations in a million invoice lines
The obvious filter, quantity below zero, gets the money right and more than doubles the returned units. A walk through 1,067,371 real invoice lines in a React grid and pivot, and the filter that matches the data.
 KanuniLabs6 min read
"How much did cancellations cost us, and what got cancelled?" is one of the first questions anyone asks of sales data. In a grid it looks like a one-filter job: show the lines with a negative quantity and read the total.
On real data that filter gives the right amount of money and more than twice the real number of returned units. This post walks through why, using the same 1,067,371 transactions as the sales dashboard post: Online Retail II, two years of invoices from a UK online retailer, loaded into the browser once. Every number below was read off the live demo and checked against the source file.
The obvious filter
Filter the Qty column to values below zero. The grid keeps 22,950 of the 1,067,371 lines, and the footer totals them: −1,064,078 units and −£1,527,041.43.
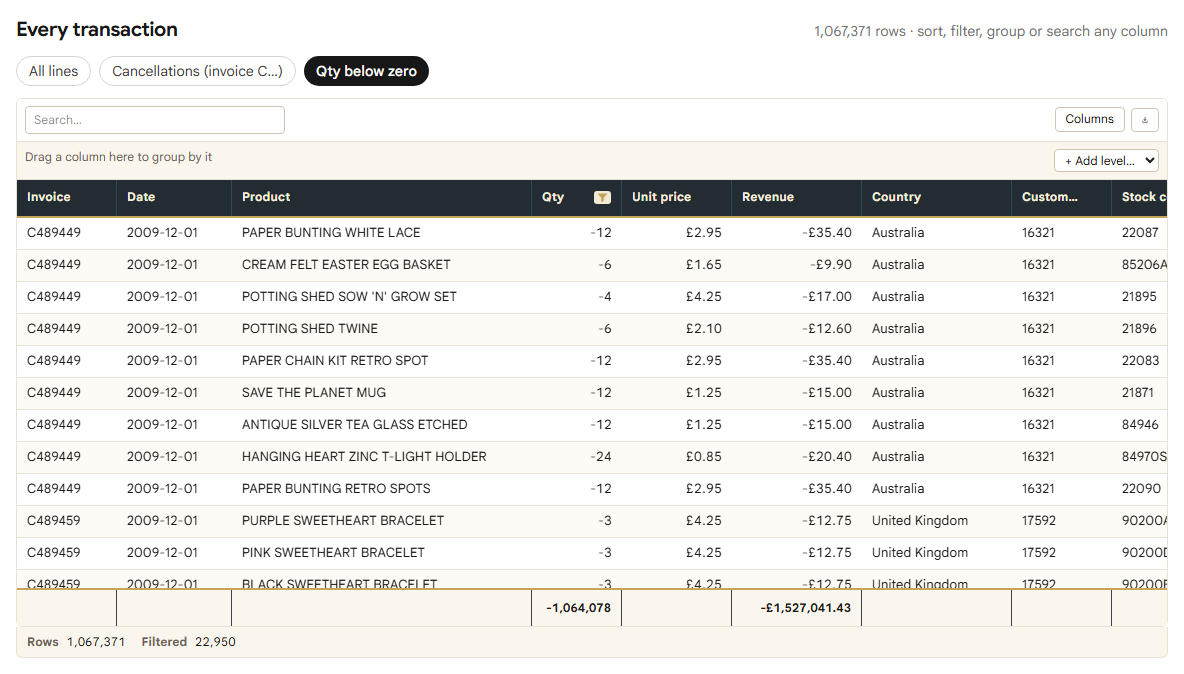
In code, through the grid's onReady handle:
grid.setColumnFilter('quantity', {
  columnId: 'quantity',
  operator: '<',
  value: 0,
});
The filter that matches the data
The dataset's own description says how a cancellation is marked: its invoice number starts with a C. Filter on that instead:
grid.setColumnFilter('invoice', {
  columnId: 'invoice',
  operator: 'startswith',
  value: 'C',
});
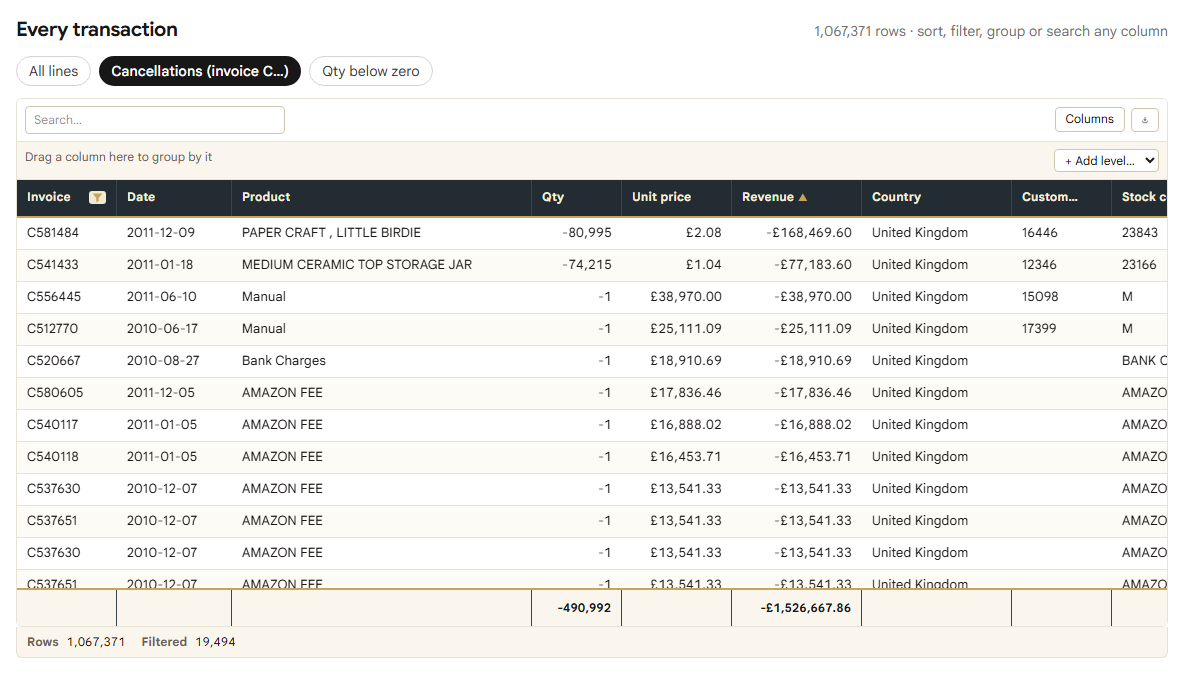
Now the grid keeps 19,494 lines: −490,992 units and −£1,526,667.86.
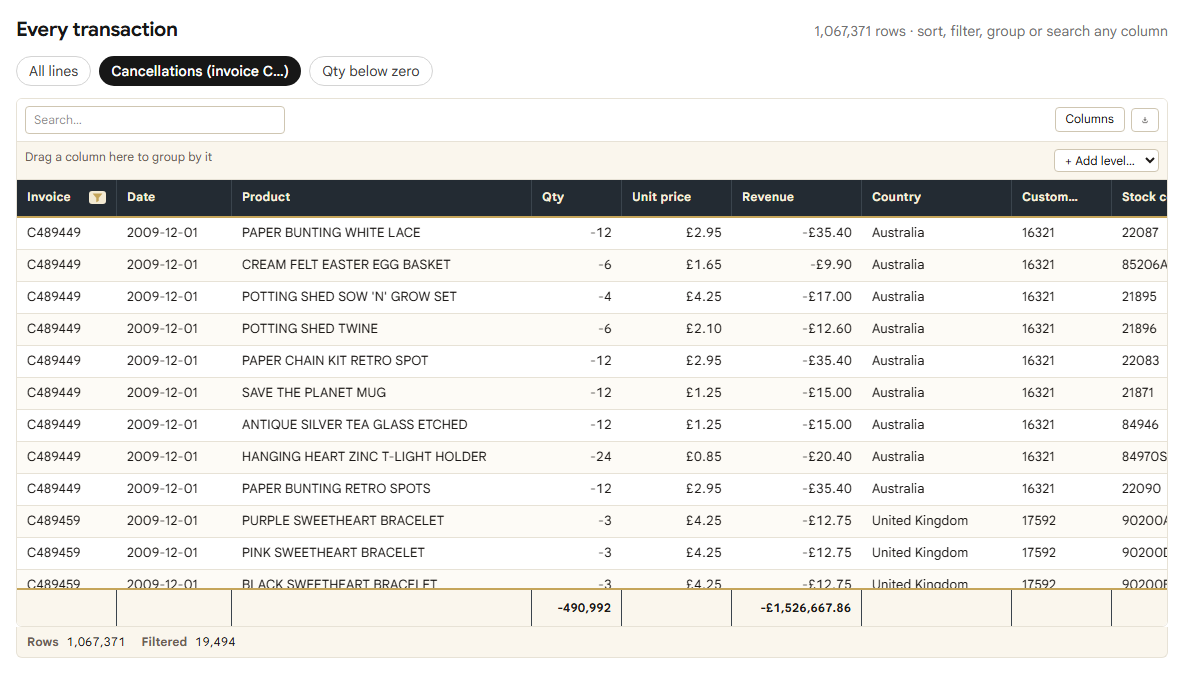
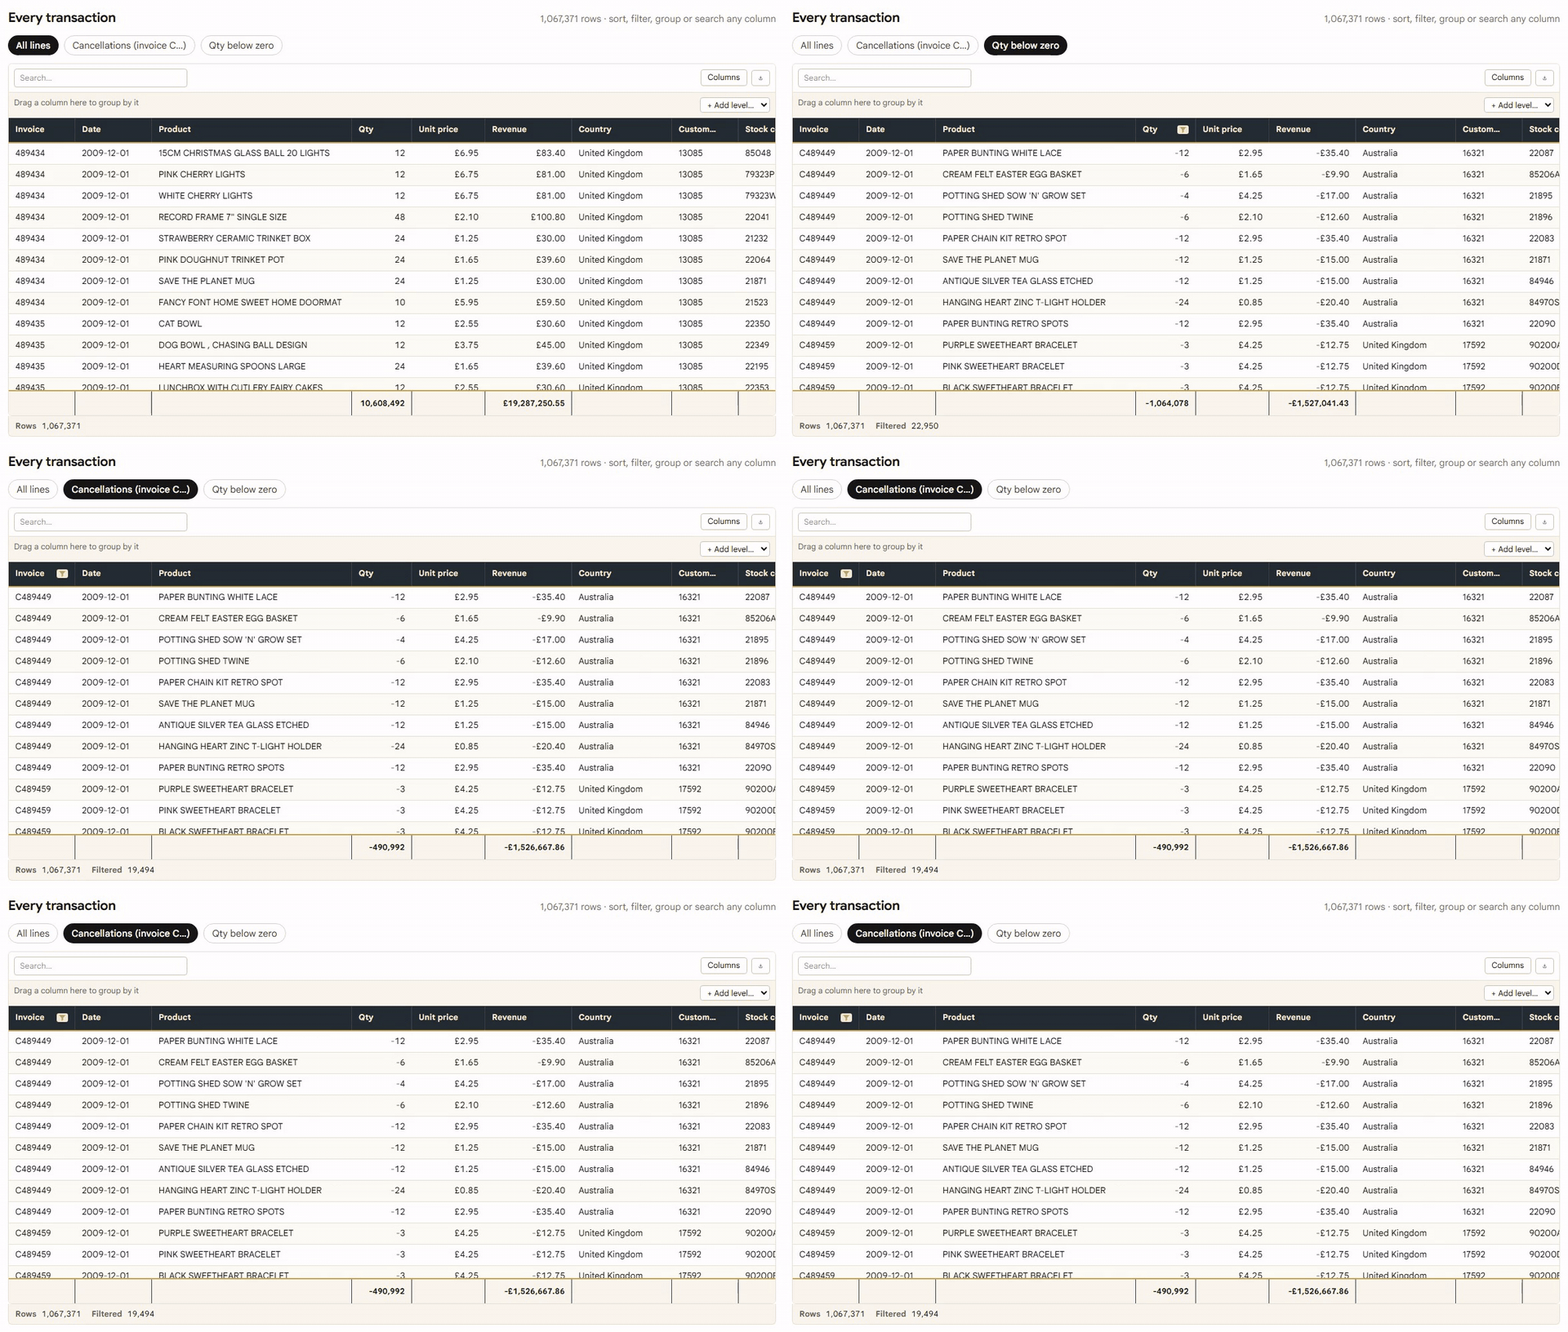
The demo has both filters as buttons above the grid, so you can switch between them and watch the footer:
What the difference is
The two totals differ by £373.57 and by 573,085 units.
The £373.57 is one line: a "Manual" adjustment on cancellation invoice C496350 with a quantity of +1, which the quantity filter misses.
The 573,085 units are 3,457 lines that have a negative quantity, an ordinary invoice number and a unit price of £0. Sort the quantity-filtered view by revenue, largest first, and they come to the top, because every real return is negative:
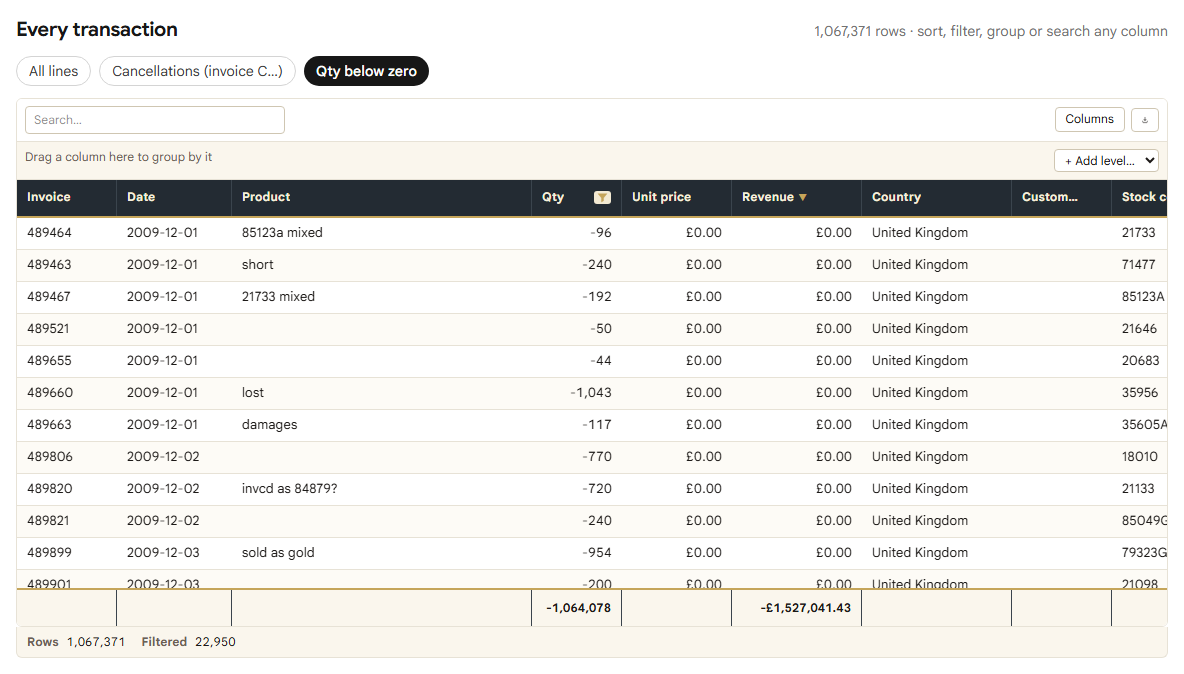
These are stock write-offs. 2,689 of them have no description at all; the rest say things like "damages", "lost", "check" or "?". They move no money, which is why the revenue totals agree. They do move units, so a returns report built on quantity < 0 would count more than twice the goods customers actually sent back.
So the question decides the filter. For the money, either one is close enough. For anything about units, return rates or products, filter on the invoice.
The largest cancellations
With the invoice filter on, sort Revenue ascending. The first line is the order from the last post: 80,995 paper craft birds, cancelled on 9 December 2011 as C581484 for −£168,469.60. The second is 74,215 ceramic storage jars, −£77,183.60.
What actually got cancelled
Single lines mislead in the other direction, so the next step is a pivot: products in the rows, revenue and units summed, the ten largest by cancelled revenue.
To slice by "is this a cancellation", the rows need a field that says so. The source has none, so we derive one while decoding:
kind: invoice[0] === 'C' ? 'Cancellation'
    : invoice[0] === 'A' ? 'Adjustment'   // six bad-debt adjustments
    : 'Sale',
Then the pivot:
const fields = [
  { id: 'kind', dataField: 'kind', caption: 'Kind', dataType: 'string',
    area: 'column', filterValues: new Set(['Cancellation']) },
  { id: 'product', dataField: 'description', caption: 'Product', dataType: 'string',
    area: 'row', sortBySummaryField: 'revenue', sortOrder: 'asc', topN: 10 },
  { id: 'revenue', dataField: 'revenue', caption: 'Revenue', dataType: 'number',
    area: 'data', summaryType: 'sum' },
  { id: 'units', dataField: 'quantity', caption: 'Units', dataType: 'number',
    area: 'data', summaryType: 'sum' },
];
sortOrder: 'asc' because cancelled revenue is negative: the largest refund is the smallest number.
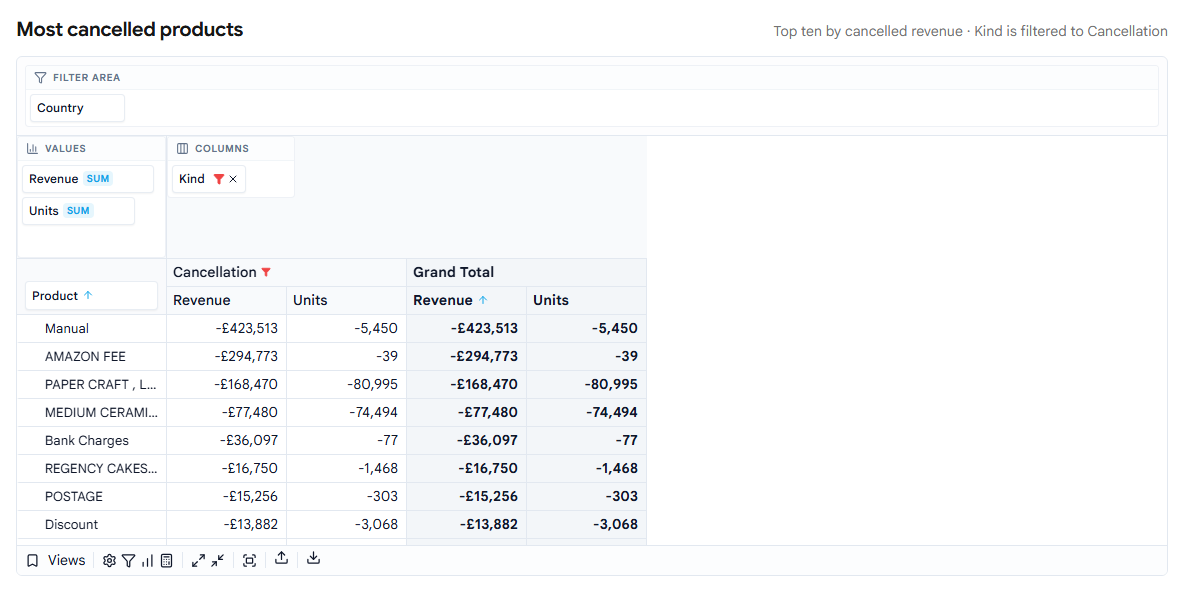
| Product | Cancelled revenue | Units |
|---|---|---|
| Manual | −£423,513 | −5,450 |
| AMAZON FEE | −£294,773 | −39 |
| PAPER CRAFT , LITTLE BIRDIE | −£168,470 | −80,995 |
| MEDIUM CERAMIC TOP STORAGE JAR | −£77,480 | −74,494 |
| Bank Charges | −£36,097 | −77 |
| REGENCY CAKESTAND 3 TIER | −£16,750 | −1,468 |
| POSTAGE | −£15,256 | −303 |
| Discount | −£13,882 | −3,068 |
| WHITE HANGING HEART T-LIGHT HOLDER | −£9,390 | −3,638 |
| CRUK Commission | −£7,933 | −16 |
The two largest are not products. "Manual" and "AMAZON FEE" together are −£718,285, 47% of everything cancelled. Six of the top ten are fees, charges, postage, discounts or manual corrections. A chart of "most returned products" that does not exclude them is mostly a chart of bookkeeping.
Kind sits in the column area rather than the filter area on purpose: with filterValues on it, the pivot shows a single "Cancellation" header, so the screen says what is being counted.
Which markets cancel most
Swap the layout: countries in the rows, Kind in the columns, revenue in the cells, the ten largest markets.
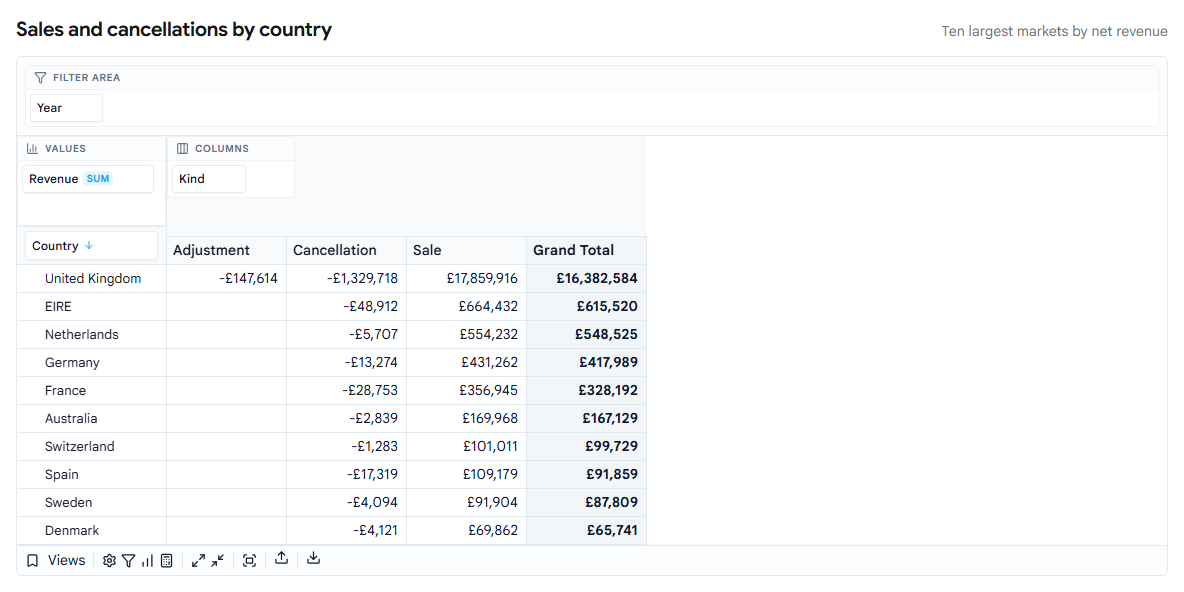
Across the whole dataset, cancellations are £1,526,668 against £20,961,532 of sales, 7.3%. Per market, as a share of that market's sales:
- Spain: 15.9% (−£17,319 on £109,179)
- France: 8.1%
- United Kingdom: 7.4%
- EIRE: 7.4%
- Netherlands: 1.0%
Spain's rate is the highest and also the easiest to over-read: it is £17,319 across 91 cancellation lines, small enough for a handful of orders to move it.
What this approach costs
- The convention is this dataset's. "Invoice starts with C" is how this retailer's export marks a cancellation. Your system will have its own field or code; the lesson is to filter on that, not on the sign of a number.
- A cancellation is not always a customer return. Manual corrections, marketplace fees and bank charges are cancelled the same way. Decide what you are counting before you count it.
- The file has exact duplicates. 34,335 lines appear more than once, 390 of them cancellations; you can see two pairs of AMAZON FEE lines in the sorted view above. We kept every row, as in the previous post, so the totals here match the published file. A real report would deduplicate first and come out slightly lower.
- The data ends on 9 December 2011, so the last month is a week, and the largest cancellation in the set happened on its last day.
- The pivot cuts long product names in its row header at the default width. The table above has them in full.
Try it
The demo opens in each state from a link: quantity below zero, cancellations only, cancellations, largest first, the most cancelled products and cancellations by country. The filters, the footer totals, sorting a pivot by a measure and Top-N are all in the free Community packages; the DataGrid and PivotGrid docs cover each prop used here.
Data: Online Retail II, UCI Machine Learning Repository (Chen, 2019), CC BY 4.0.
Disclosure: this article was drafted with AI assistance. The demo, the data processing and every number in it were produced and checked against the published dataset and our packages in October 2026.