A free pivot table for React and JavaScript
Your users drag fields across a million rows and build the report they were about to ask you for. The totals are computed in a Web Worker, and a data grid comes with it. 127 of 186 features need no licence key.
Try them, right here
Two components, real data, running in your browser. Nothing to install.
DataGrid
ReactBuilt for ReactJavaScriptPlain JavaScript, no framework requiredPivotGrid
ReactBuilt for ReactJavaScriptPlain JavaScript, no framework required127 of 186 features need no licence key
No trial clock, no watermark, no signup. Commercial use included. The paid tiers start where you change the data and where you take it out — editing, grouping on the server, styled Excel and PDF export, charts.
Install and render
npm install @kanunilabs/datagrid-reactimport { DataGrid } from '@kanunilabs/datagrid-react';
import '@kanunilabs/datagrid-react/styles.css';
<DataGrid
gridId="sales"
dataSource={rows}
rowKey="id"
columns={columns}
style={{ height: 600 }}
/>No bundler configuration: the Web Worker is compiled into the package and started from a Blob URL. Prefer no framework? createGrid() does the same without React.
Measured, and reproducible
- Sort, numeric
- 101 ms
- Sort, text
- 90 ms
- first query 1.8 s
- Filter, equality
- 18 ms
- Free-text search
- 65 ms
- first query 413 ms
1,000,000 rows × 9 columns, columnar engine, median of 3 runs; a first query builds a per-column index. The method, and the command to run it yourself.
- 5,818 tests across 710 files
- 119/119 DataGrid features have a live, editable demo
- 55 published releases
- 12 locales, Arabic RTL included
Example apps
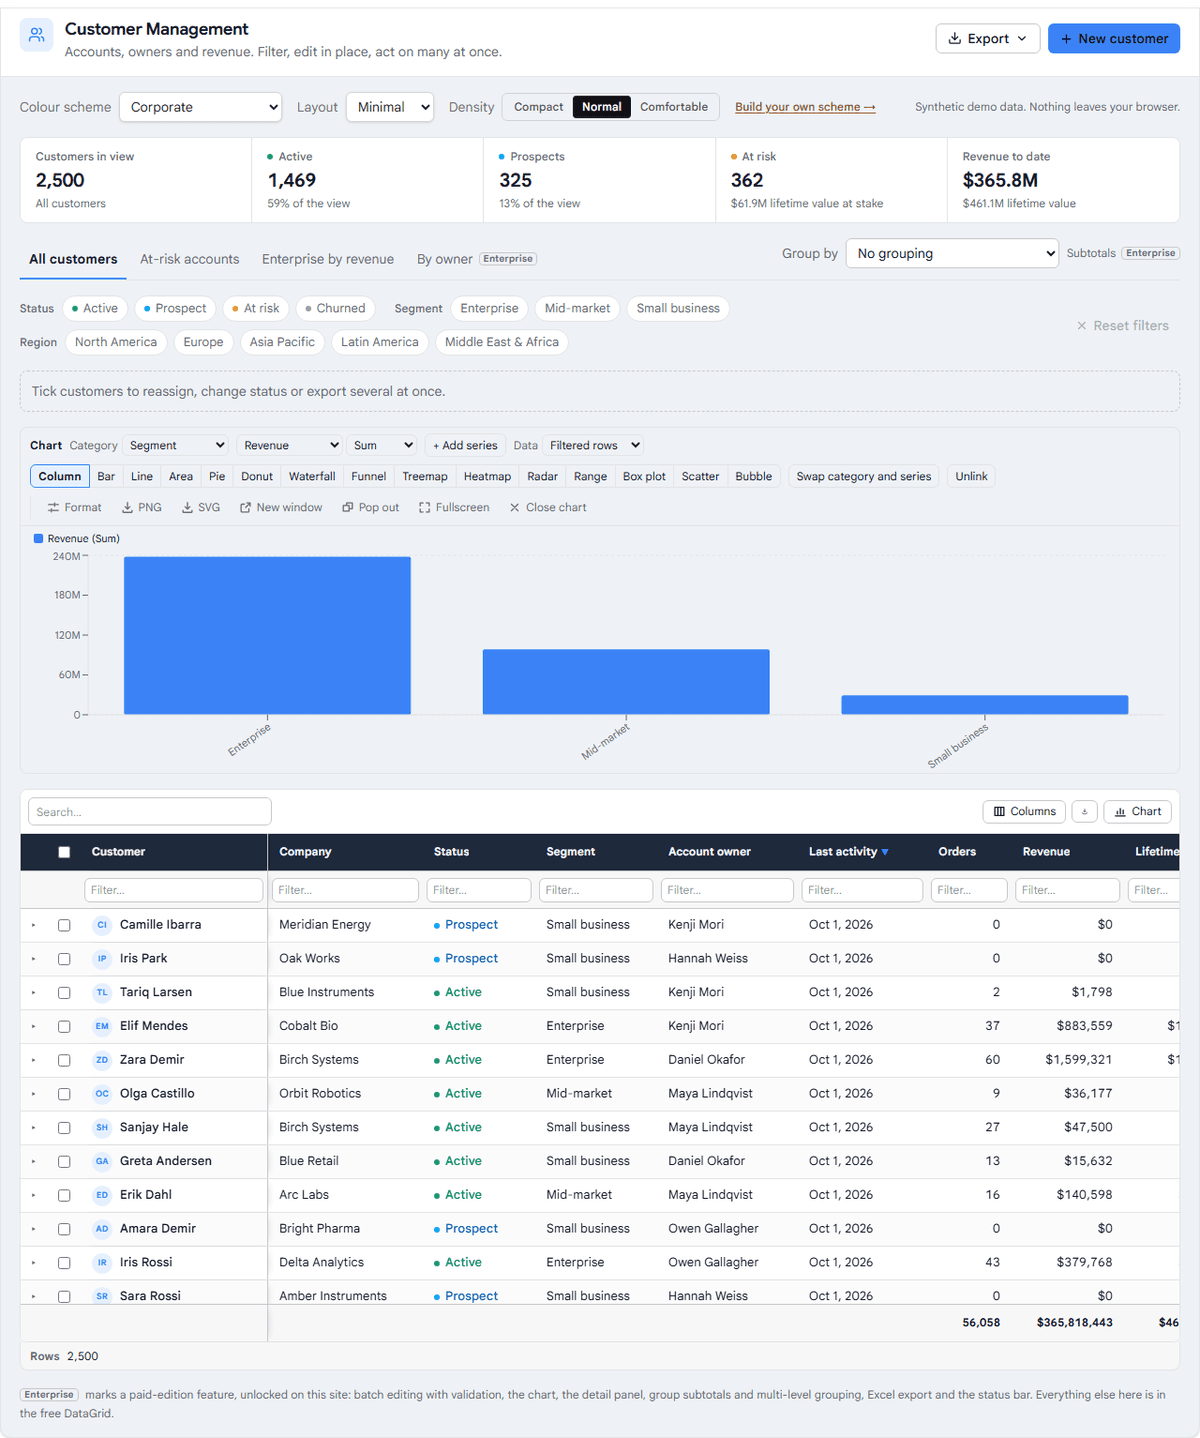
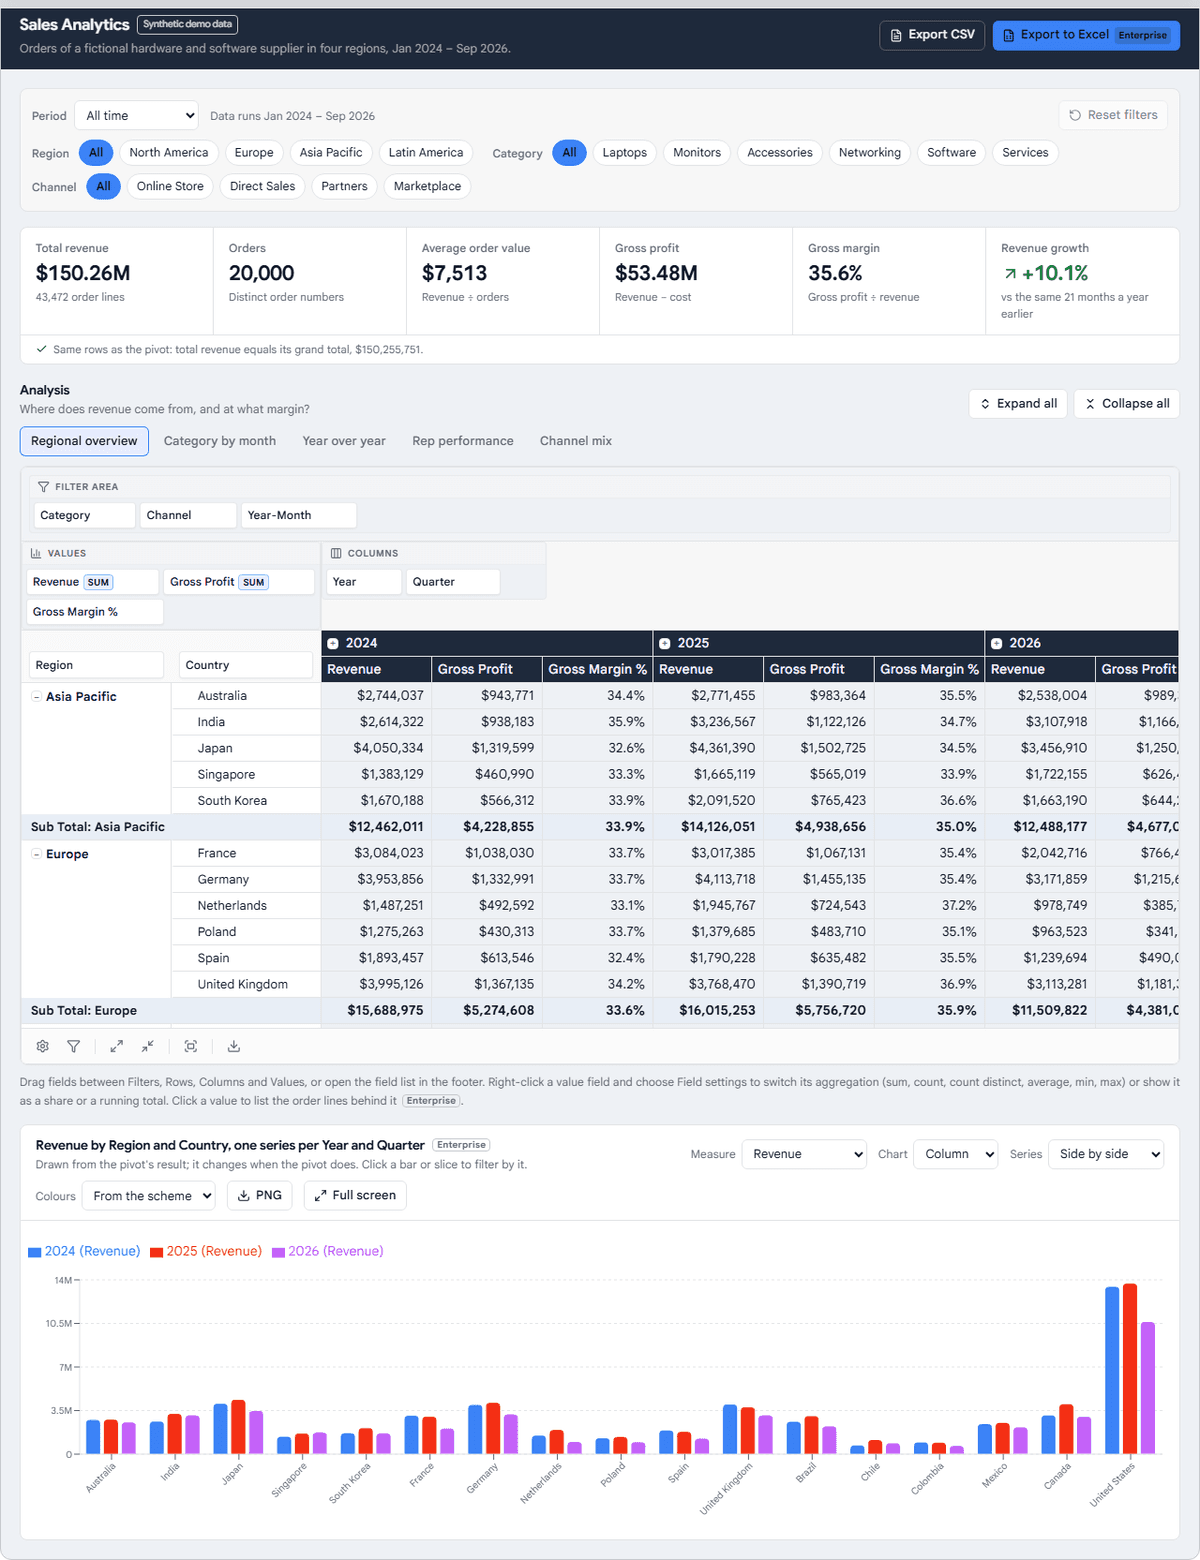
Two applications built on the grids
A customer module and a sales analysis tool on synthetic data. Filter, edit, pivot and chart them the way your users would.
One core, many components
A framework-agnostic core powering a growing suite of high-performance data components.
Everything you expect — and faster
Built on a framework-agnostic core with a battle-tested Web Worker engine, delivered as polished React components.
Web Worker engine
Columnar storage + trie grouping keep the UI smooth on huge datasets.
Calculated fields
CSP-safe formula editor with live preview — no eval, no risk.
Charts
Sync any pivot view to a chart with one prop. Powered by Recharts.
Advanced filtering
Visual prefilter builder, header filters, and drill-down to source rows.
Export
Excel and PDF export, streamed off the main thread for large grids.
12 locales + RTL
Localized out of the box, including full right-to-left support.
Make the grid look like your product
Pick one of 36 light and dark colour schemes, or build your own in the Theme Builder: change any colour on a live DataGrid and PivotGrid, check the contrast as you go, and export the stylesheet. Free, for React and plain JavaScript.
Open the Theme BuilderQuestions people ask first
Is it really free?
The Community edition is, for both components: 75 of the 119 DataGrid features and 52 of the 67 PivotGrid features work with no licence key, no watermark and no expiry, and commercial use is included. Editing cells, whole rows and forms is included. Paid tiers add editing validation and undo, grouping on the server, styled Excel and PDF export, charts and multi-level grouping.
Is it open source?
No. Community is free of charge but proprietary — the source is not distributed. If an OSI-approved licence is a requirement for you, this is the wrong library and it is better to know now.
Which frameworks are supported?
React 18+ and plain JavaScript with no framework at all. The JavaScript renderer has full feature parity, enforced in CI, and ships a UMD build so a script tag is a complete install. Angular and Vue are not supported today.
How fast is it, really?
At 1,000,000 rows by 9 columns, on the code path the worker runs, median of 3 runs: numeric sort 101 ms, text sort 90 ms cached (1.8 s on the first query, which builds a sort index), equality filter 18 ms, free-text search 65 ms cached (413 ms on the first query). The performance page publishes the method and the command so you can run it on your own machine.
Do I need to configure a Web Worker?
No. The worker is compiled into the package and started from a Blob URL, so there is no file to copy into public/, no bundler recipe and nothing to import. Vite, webpack, Next.js and Parcel all work as they are — and so does no bundler at all.
One licence covers both components?
Yes. A paid key unlocks the Enterprise features of DataGrid and PivotGrid together. There is no second purchase and no second key.
What happens when my subscription ends?
You keep the last version you paid for, and applications already shipped with it stay licensed and keep working. You stop receiving new versions and support. Nothing you have deployed starts showing a watermark.
Can I try it before buying?
Install the Community edition and build with it for as long as you like — it is not a trial. The paid features have live, editable demos in the playground, and the enterprise guides show the configuration. There is no time-limited trial key; instead, every purchase can be refunded in full within 14 days, for any reason.
See it handle real data
Pivot, filter, and chart a large sales dataset right in your browser — no signup.