Three ways an Excel export stops matching the screen, measured on a million rows
An Export button is easy. A file that says what the screen said is not. We exported 1,067,371 real invoice lines and opened them in Excel: dates arrived as text, subtotals vanished, and 18,843 rows past the sheet limit were silently cut.
 KanuniLabs7 min read
Sooner or later someone asks for an Export button on a table, because whatever they do next with the numbers, they do it in Excel. Writing an .xlsx file from the browser is not the hard part. The hard part is a file that says what the screen said:
- the rows the filter left, all of them, not just the ones on screen;
- numbers that are still numbers, so a
SUMworks, with the currency and the red negatives; - dates that are dates;
- the groups, their subtotals and the grand total;
- and every row, even when there are more than a sheet holds.
We exported the 1,067,371 invoice lines of the Online Retail II dataset, grouped by country, with our grid's own Excel export, and opened the files in Excel to check each of those. Three checks failed, in our own product. All three are fixed in @kanunilabs/datagrid-react-enterprise 1.5.0 (with @kanunilabs/datagrid-core 1.6.0), released on 6 October. This post shows what the file looked like before, what it looks like now, and how to check any export, not just ours. The demo runs the same export in your browser.
The report
One month is the kind of export someone actually sends: November 2011, 84,711 lines from 24 countries, grouped by country, with a subtotal on every group and a grand total underneath.
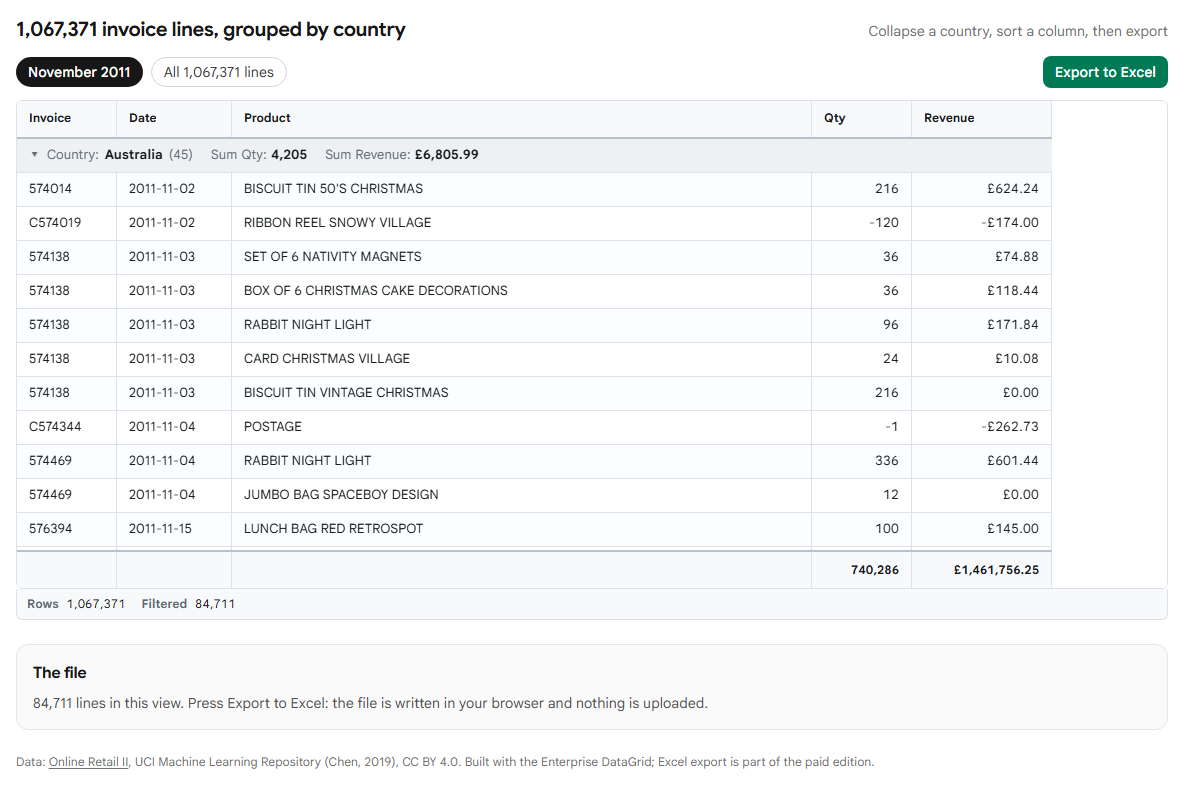
The export call adds a title above the table:
const { blob, fileName } = await grid.exportToExcel({
  fileName: 'online-retail-2011-11',
  headerBlock: [
    { cells: ['Online Retail II: November 2011, by country'], merge: true, style: { font: { bold: true, size: 14 } } },
    { cells: [`Exported ${today}`] },
    { cells: [] },
  ],
});
In the browser that took 7.5 seconds, including fetching the Excel library on first use, and wrote a 2.1 MB file. Every Excel image in this post is Excel's own rendering of the exported file.
What arrived right
Numbers are numbers. Quantity and revenue are written as numbers, not as the text on screen, so SUM, sorting and charts work on them. The look comes from an Excel number format declared on the column, next to the formatter the grid uses:
{
  field: 'revenue',
  dataType: 'number',
  valueFormatter: (v) => gbp(v),                   // what the grid shows: £624.24
  excelFormat: '"£"#,##0.00;[Red]-"£"#,##0.00',    // what Excel shows, from a number
}
Without excelFormat a number column gets a plain thousands separator. The writer never guesses a currency or a percentage, because guessing changes what the number means.
The whole result. All 84,711 lines, not just the rows on screen.
Groups you can fold. Each country is a real Excel outline level, so the reader can collapse it with Excel's own + and − buttons.
The grand total. 740,286 units and £1,461,756.25, the same as the footer.
1. The subtotals did not arrive
On screen, every country's header carries its subtotals: Australia, 45 lines, 4,205 units, £6,805.99. In the file, the same row said Australia (45) and the rest of it was empty:
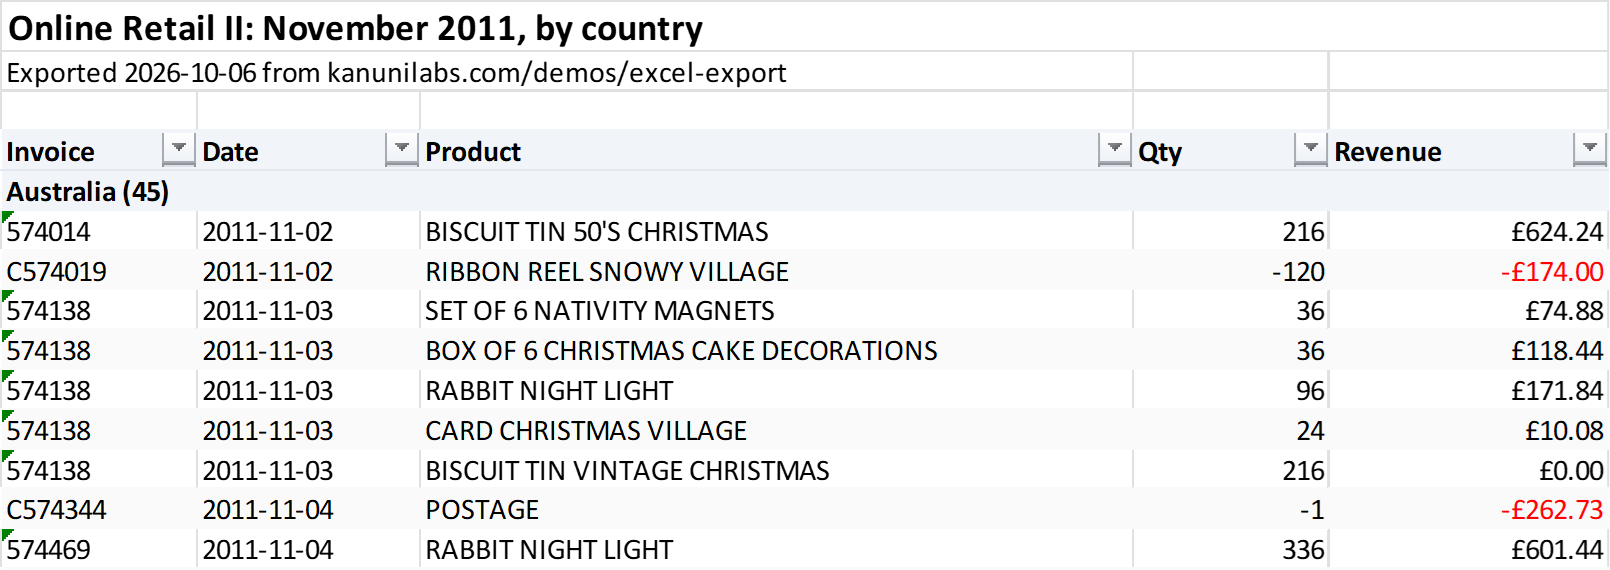
Nothing in the file said something was missing. A reader who wanted Australia's revenue had to select the 45 cells and read Excel's status bar, and trust that they had selected the right rows. The grand total made it; the subtotals were never read from the group.
Now each subtotal sits in its own column, as a number in the column's format:
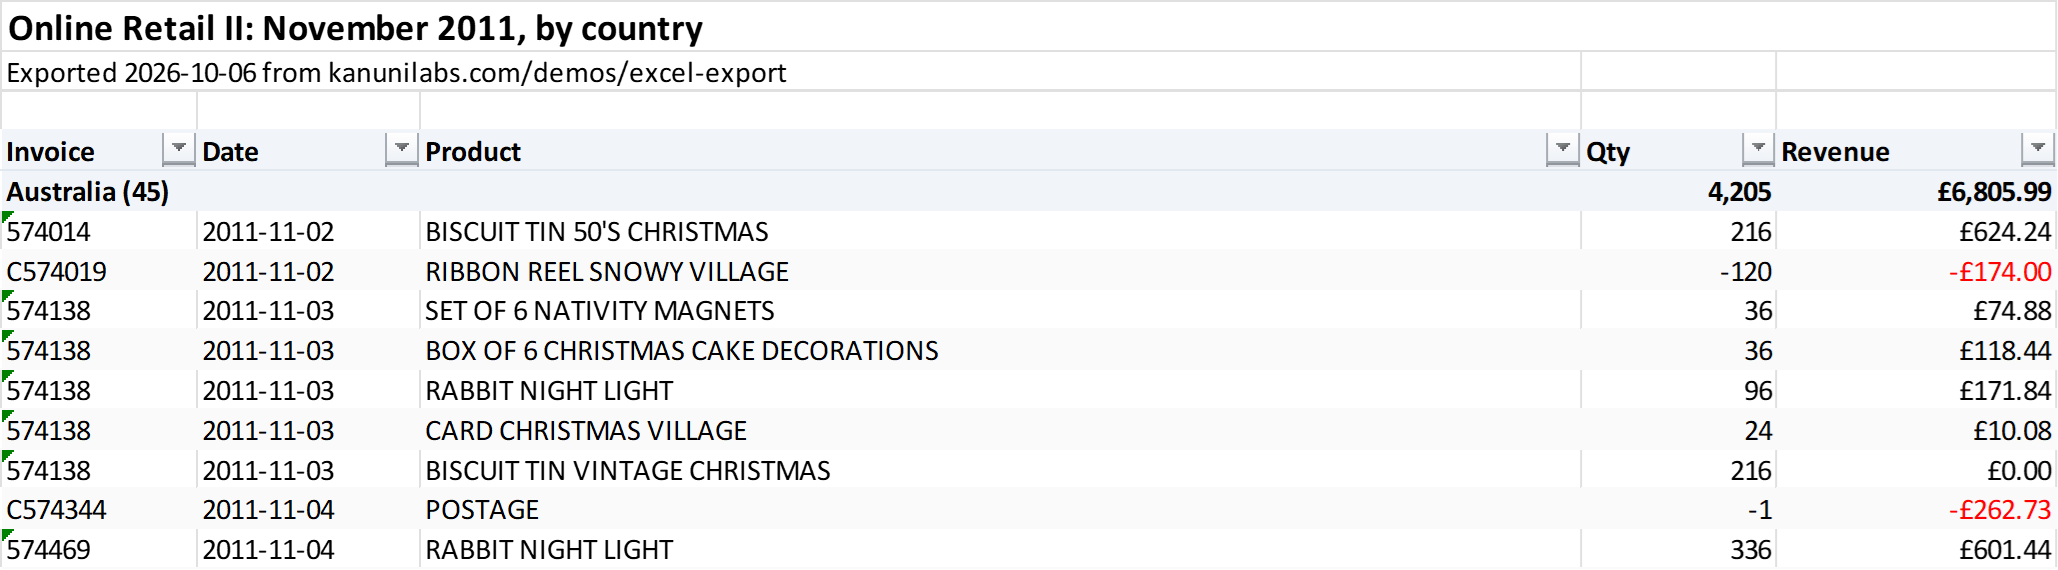
To check any export: collapse every group in the grid, then click the outline button marked 1 at the top left of the sheet in Excel. Both should show the same numbers.
2. The dates arrived as text
The date column looked right in Excel: 2011-11-02. Ask Excel what the cell holds and it said text, and the filter on that column offered text filters instead of date filters:

The cause is not specific to us, which is why it is worth knowing. JSON has no date type, so dates come from an API as strings like "2011-11-02". Our export wrote a real Excel date only when the value was a JavaScript Date; a string went in as the string.
Fixing it turned up a second one. A Date was written by its UTC instant, and Excel has no time zones. In Istanbul, new Date(2011, 10, 1), local midnight on 1 November, is 22:00 on 31 October in UTC, and that is the day Excel showed. We measured it before the fix: the cell read 2011-10-31. West of UTC the same rule lands on the right day, which is how it hides.
If you write an export yourself, both have the same answer: build the Excel date from the local calendar day, never from the UTC instant.
// new Date('2011-11-02') is midnight UTC: in New York that is 1 November, 20:00.
const [y, m, d] = value.split('-').map(Number);
const date = new Date(y, m - 1, d); // midnight where the user is, which is what the sheet shows
Now a date column's ISO string, epoch number or Date arrives as a real Excel date on the day the grid shows; text that is not a date stays text.

To check any export: next to a date, type =ISNUMBER(B6). A real date is a number to Excel.
3. The whole table did not fit
An Excel sheet holds 1,048,576 rows. Switch the demo to all 1,067,371 lines and export: with 43 country headers, the title rows and the total, that is 1,067,419 rows, 18,843 more than a sheet holds. Before the fix the writer did not count, and nothing warned the user.
Excel did not refuse that file. It said:
We found a problem with some content in 'online-retail-all.xlsx'. Do you want us to try to recover as much as we can?
Click Yes and the sheet opened and looked complete. It was not. We saved the repaired file and counted what was left: Excel kept the first 1,048,576 rows and dropped the rest. Here that was the last 17,494 lines of the United Kingdom, all of Unspecified (756 lines), the USA (535) and the West Indies (54), and the grand total. The only trace was a line in the repair dialog about "cell information" being removed, which most people close without reading.
Now the rows past the limit continue on a second sheet, "Data (2)", with the header and its filter repeated:

In the browser the whole table now takes 45 seconds and writes 25.7 MB: 1,048,576 rows on the first sheet, and the remaining 18,843 under the header on the second, the grand total last. A maxRowsPerSheet option lowers the limit, if a smaller sheet suits your readers.
Splitting is one honest answer. The other two are to stop and ask the user to filter first (nobody reads a million rows in Excel; an export that size is usually a mistake), or to write CSV and say plainly that Excel will not open all of it either. Silently writing a file Excel will cut is not one of them.
To check any export: compare the row count the grid shows with the last row in Excel (Ctrl+End), on every sheet.
What this costs
- It is paid. Excel export is in the Enterprise edition of the grid; without a licence key it runs with a watermark, so you can try everything here first. CSV export is in the free Community package.
- It runs in the browser. The file is built on the user's machine, and the whole file is in memory until it is saved: 7.5 seconds for the month here, 45 seconds for the whole table.
exceljsis an optional dependency, loaded only when someone exports.
Try it
The demo is at /demos/excel-export; /demos/excel-export?view=all opens it on the whole table. The export docs cover CSV, PDF, per-cell styling, logos and more than one grid per workbook.
Data: Online Retail II, UCI Machine Learning Repository (Chen, 2019), CC BY 4.0.
Disclosure: this article was drafted with AI assistance. The demo and every behaviour described were checked against our packages, the published dataset and Microsoft Excel in October 2026.