Una tabella pivot gratuita per React e JavaScript
I tuoi utenti trascinano i campi su un milione di righe e si costruiscono da soli il report che stavano per chiederti. I totali sono calcolati in un Web Worker e c'è anche una data grid. 122 delle 185 funzionalità non richiedono una chiave di licenza.
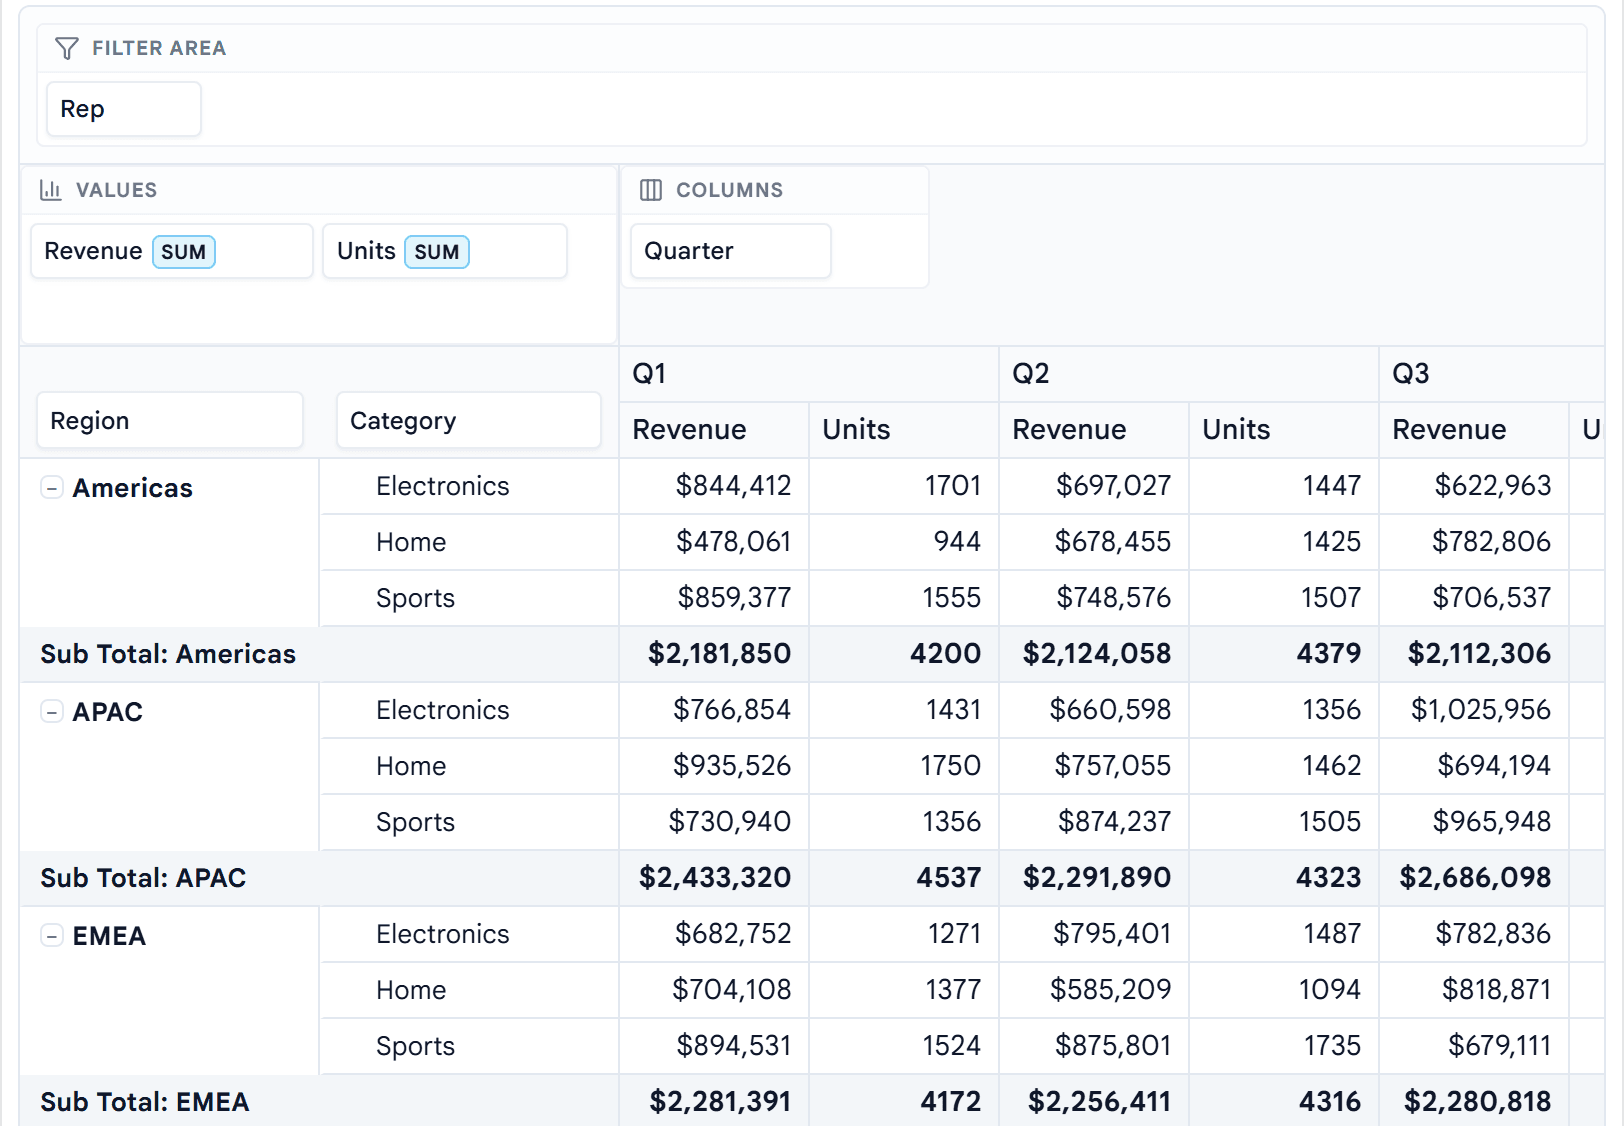
Provali qui
Due componenti, dati reali, nel tuo browser. Niente da installare.
DataGrid
ReactBuilt for ReactJavaScriptPlain JavaScript, no framework requiredPivotGrid
ReactBuilt for ReactJavaScriptPlain JavaScript, no framework required122 of 185 features need no licence key
No trial clock, no watermark, no signup. Commercial use included. The paid tiers start where you change the data and where you take it out — editing, grouping on the server, styled Excel and PDF export, charts.
Install and render
npm install @kanunilabs/datagrid-reactimport { DataGrid } from '@kanunilabs/datagrid-react';
import '@kanunilabs/datagrid-react/styles.css';
<DataGrid
gridId="sales"
dataSource={rows}
rowKey="id"
columns={columns}
style={{ height: 600 }}
/>No bundler configuration: the Web Worker is compiled into the package and started from a Blob URL. Prefer no framework? createGrid() does the same without React.
Measured, and reproducible
- Sort, numeric
- 101 ms
- Sort, text
- 90 ms
- first query 1.8 s
- Filter, equality
- 18 ms
- Free-text search
- 65 ms
- first query 413 ms
1,000,000 rows × 9 columns, columnar engine, median of 3 runs; a first query builds a per-column index. The method, and the command to run it yourself.
- 4,939 tests across 582 files
- 118/118 DataGrid features have a live, editable demo
- 37 published releases
- 12 locales, Arabic RTL included
Un core, molti componenti
Un core indipendente dal framework alla base di una suite crescente di componenti dati ad alte prestazioni.
PivotGrid
Tabelle pivot ad alte prestazioni con motore Web Worker, campi calcolati, grafici ed export.
DataGrid
Una griglia dati veloce e virtualizzata — ordinamento, filtri, raggruppamento e modifica in linea.
Tutto ciò che ti aspetti
Indipendente dal framework.
Motore Web Worker
Mantiene fluida l'interfaccia utente.
Campi calcolati
Editor di formule sicuro con anteprima live.
Grafici
Sincronizza la vista pivot con un grafico in una proprietà.
Filtro avanzato
Costruttore visivo di pre-filtri e filtri di intestazione.
Esportazione
Esportazione Excel e PDF off-thread.
12 lingue
Localizzazione pronta all'uso con supporto RTL.
Il grid con l’aspetto del tuo prodotto
Scegli uno dei 36 schemi di colori chiari e scuri, o crea il tuo nel Generatore di temi: cambia qualsiasi colore su un DataGrid e un PivotGrid dal vivo, controlla il contrasto mentre lavori ed esporta il foglio di stile. Gratuito, per React e JavaScript puro.
Apri il Generatore di temiQuestions people ask first
Is it really free?
The Community edition is, for both components: 70 of the 118 DataGrid features and 52 of the 67 PivotGrid features work with no licence key, no watermark and no expiry, and commercial use is included. Editing a cell in place is included. Paid tiers add batch and form editing with validation and undo, grouping on the server, styled Excel and PDF export, charts and multi-level grouping.
Is it open source?
No. Community is free of charge but proprietary — the source is not distributed. If an OSI-approved licence is a requirement for you, this is the wrong library and it is better to know now.
Which frameworks are supported?
React 18+ and plain JavaScript with no framework at all. The JavaScript renderer has full feature parity, enforced in CI, and ships a UMD build so a script tag is a complete install. Angular and Vue are not supported today.
How fast is it, really?
At 1,000,000 rows by 9 columns, on the code path the worker runs, median of 3 runs: numeric sort 101 ms, text sort 90 ms cached (1.8 s on the first query, which builds a sort index), equality filter 18 ms, free-text search 65 ms cached (413 ms on the first query). The performance page publishes the method and the command so you can run it on your own machine.
Do I need to configure a Web Worker?
No. The worker is compiled into the package and started from a Blob URL, so there is no file to copy into public/, no bundler recipe and nothing to import. Vite, webpack, Next.js and Parcel all work as they are — and so does no bundler at all.
One licence covers both components?
Yes. A paid key unlocks the Enterprise features of DataGrid and PivotGrid together. There is no second purchase and no second key.
What happens when my subscription ends?
You keep the last version you paid for, and applications already shipped with it stay licensed and keep working. You stop receiving new versions and support. Nothing you have deployed starts showing a watermark.
Can I try it before buying?
Install the Community edition and build with it for as long as you like — it is not a trial. The paid features have live, editable demos in the playground, and the enterprise guides show the configuration. There is no time-limited trial key; instead, every purchase can be refunded in full within 14 days, for any reason.