Eine kostenlose Pivot-Tabelle für React und JavaScript
Ihre Nutzer ziehen Felder über eine Million Zeilen und bauen sich den Bericht, um den sie Sie sonst bitten würden. Die Summen werden in einem Web Worker berechnet, ein Data Grid gehört dazu. 122 von 185 Funktionen brauchen keinen Lizenzschlüssel.
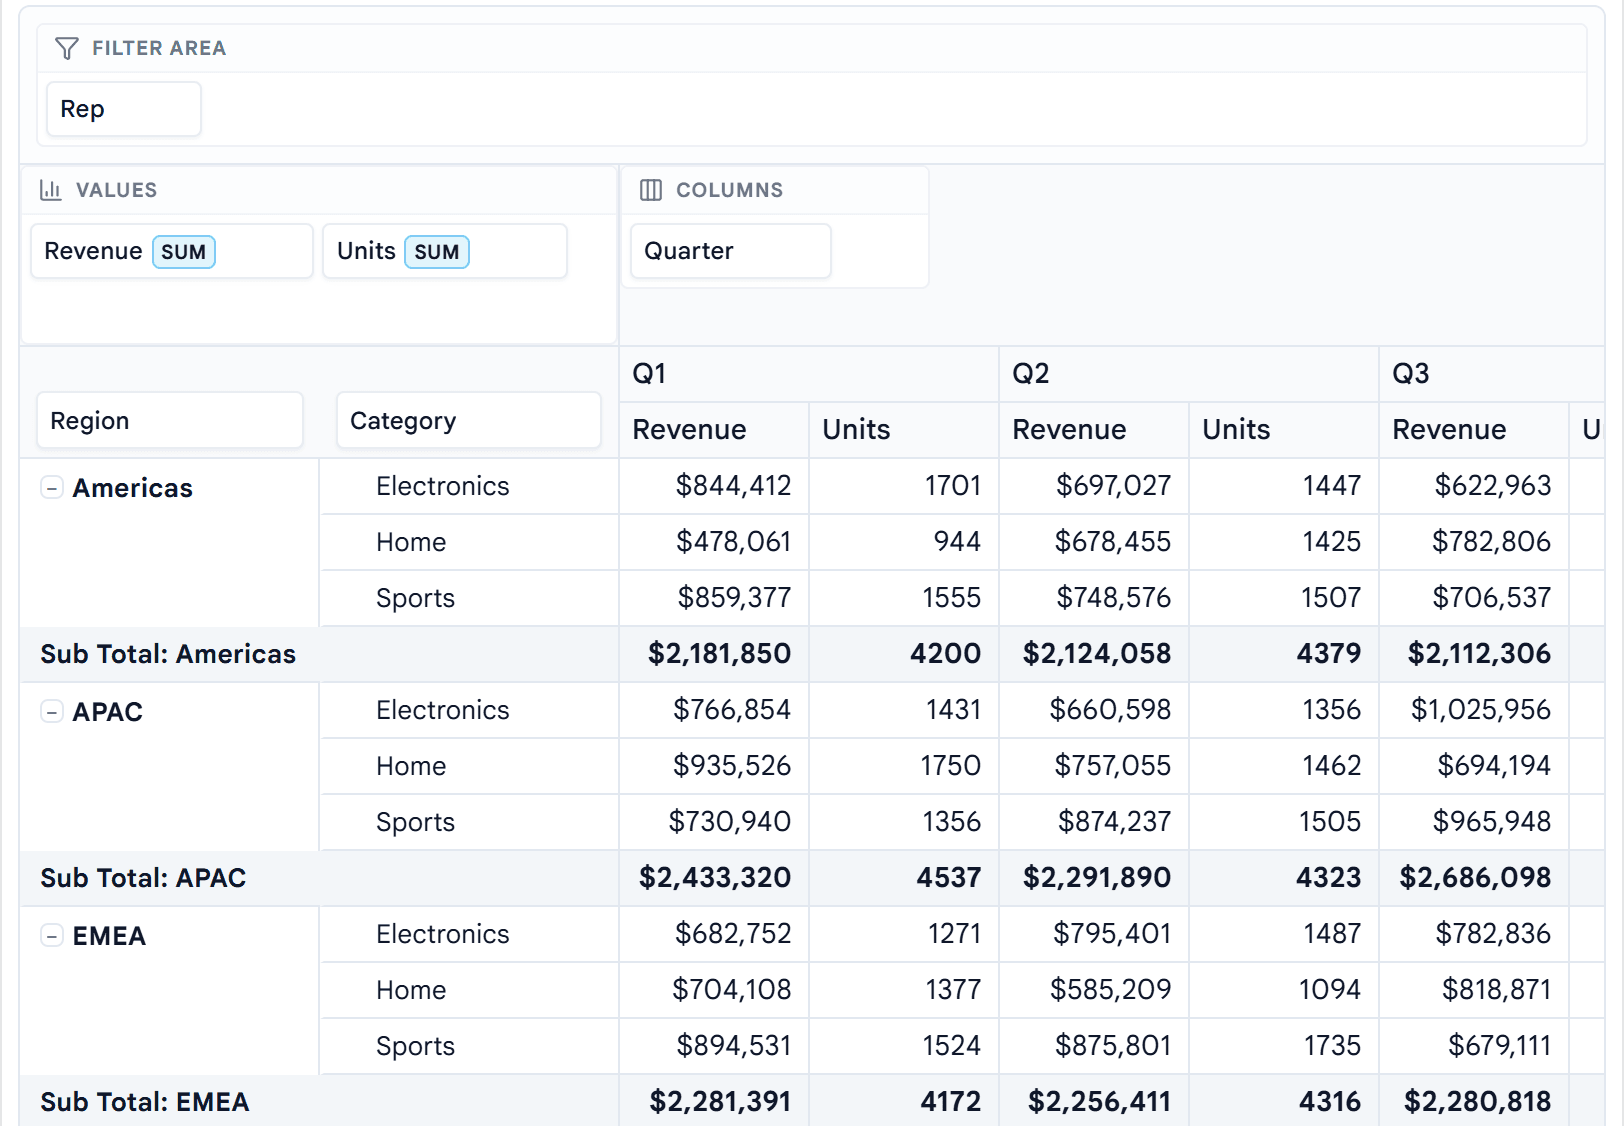
Gleich hier ausprobieren
Zwei Komponenten, echte Daten, direkt im Browser. Nichts zu installieren.
DataGrid
ReactBuilt for ReactJavaScriptPlain JavaScript, no framework requiredPivotGrid
ReactBuilt for ReactJavaScriptPlain JavaScript, no framework required122 of 185 features need no licence key
No trial clock, no watermark, no signup. Commercial use included. The paid tiers start where you change the data and where you take it out — editing, grouping on the server, styled Excel and PDF export, charts.
Install and render
npm install @kanunilabs/datagrid-reactimport { DataGrid } from '@kanunilabs/datagrid-react';
import '@kanunilabs/datagrid-react/styles.css';
<DataGrid
gridId="sales"
dataSource={rows}
rowKey="id"
columns={columns}
style={{ height: 600 }}
/>No bundler configuration: the Web Worker is compiled into the package and started from a Blob URL. Prefer no framework? createGrid() does the same without React.
Measured, and reproducible
- Sort, numeric
- 101 ms
- Sort, text
- 90 ms
- first query 1.8 s
- Filter, equality
- 18 ms
- Free-text search
- 65 ms
- first query 413 ms
1,000,000 rows × 9 columns, columnar engine, median of 3 runs; a first query builds a per-column index. The method, and the command to run it yourself.
- 4,939 tests across 582 files
- 118/118 DataGrid features have a live, editable demo
- 37 published releases
- 12 locales, Arabic RTL included
Ein Kern, viele Komponenten
Ein framework-unabhängiger Kern als Basis einer wachsenden Reihe leistungsstarker Datenkomponenten.
PivotGrid
Leistungsstarke Pivot-Tabellen mit Web-Worker-Engine, berechneten Feldern, Diagrammen und Export.
DataGrid
Ein schnelles, virtualisiertes Datengitter – Sortieren, Filtern, Gruppieren und Inline-Bearbeitung.
Alles, was Sie erwarten
Framework-unabhängig.
Web Worker Engine
Hält die Benutzeroberfläche bei riesigen Datensätzen flüssig.
Berechnete Felder
Sicherer Formeleditor mit Live-Vorschau.
Diagramme
Pivot-Ansicht mit einem Klick mit einem Diagramm synchronisieren.
Erweiterte Filterung
Visueller Vorfilter-Builder und Header-Filter.
Export
Excel- und PDF-Export ohne Blockierung des Haupt-Threads.
12 Sprachen + RTL
Sofortige Lokalisierung inklusive Unterstützung von rechts nach links.
Das Grid im Look Ihres Produkts
Wählen Sie eines von 36 hellen und dunklen Farbschemata oder bauen Sie im Theme Builder Ihr eigenes: jede Farbe an einem echten DataGrid und PivotGrid ändern, den Kontrast laufend prüfen und das Stylesheet exportieren. Kostenlos, für React und reines JavaScript.
Theme Builder öffnenQuestions people ask first
Is it really free?
The Community edition is, for both components: 70 of the 118 DataGrid features and 52 of the 67 PivotGrid features work with no licence key, no watermark and no expiry, and commercial use is included. Editing a cell in place is included. Paid tiers add batch and form editing with validation and undo, grouping on the server, styled Excel and PDF export, charts and multi-level grouping.
Is it open source?
No. Community is free of charge but proprietary — the source is not distributed. If an OSI-approved licence is a requirement for you, this is the wrong library and it is better to know now.
Which frameworks are supported?
React 18+ and plain JavaScript with no framework at all. The JavaScript renderer has full feature parity, enforced in CI, and ships a UMD build so a script tag is a complete install. Angular and Vue are not supported today.
How fast is it, really?
At 1,000,000 rows by 9 columns, on the code path the worker runs, median of 3 runs: numeric sort 101 ms, text sort 90 ms cached (1.8 s on the first query, which builds a sort index), equality filter 18 ms, free-text search 65 ms cached (413 ms on the first query). The performance page publishes the method and the command so you can run it on your own machine.
Do I need to configure a Web Worker?
No. The worker is compiled into the package and started from a Blob URL, so there is no file to copy into public/, no bundler recipe and nothing to import. Vite, webpack, Next.js and Parcel all work as they are — and so does no bundler at all.
One licence covers both components?
Yes. A paid key unlocks the Enterprise features of DataGrid and PivotGrid together. There is no second purchase and no second key.
What happens when my subscription ends?
You keep the last version you paid for, and applications already shipped with it stay licensed and keep working. You stop receiving new versions and support. Nothing you have deployed starts showing a watermark.
Can I try it before buying?
Install the Community edition and build with it for as long as you like — it is not a trial. The paid features have live, editable demos in the playground, and the enterprise guides show the configuration. There is no time-limited trial key; instead, every purchase can be refunded in full within 14 days, for any reason.